Predicting 2022 trends begins with reviewing 2021 predictions. How many were right and how many were wrong? The consensus from many respected organizations comes down to one word: contactless. We think 2022 will be a breakout year for QR codes and other contactless tokens (facial, biometric, SMS) ourselves. Some new re-invigorated drivers include social networks like TikTok and their videos. How POS and CMS systems can communicate effectively with customers and generate loyalty. Gift cards, giveaways and incentives will abound.
Original post from kioskindustry December 2021 —
Retail Market Research
Tech Angles
- IP Cameras now come with AI raising the intelligence and programmability of those cameras and mitigating the usual USB hooked to a PC solution
- Livestreaming (the pandemic trained us on that).
- Story on Chick-Fil-A and virtual order takers in the drive-thru (TikTok video) — link
This is the first iteration post and we will be adding more in the coming days.
Kiosk Market Research
Kiosk Market Data
- 66% of consumers prefer self-service over interacting with an employee because it is faster and less stressful. [Palmer Retail]
- Payment Options: 29% of consumers prefer contactless payments such as mobile wallets, contactless payment kiosks, and QR code payments.
- “According to a recent study on checkout lines, 69 percent of shoppers said long lines were the most irritating part of shopping,” Rob Meiner with Peerless-AV said. “That beat out high prices (66 percent) and inventory being out of stock (65 percent). Eighty-four percent of those customers said watching digital displays helped them pass the time while they waited.
- IHL Growth Numbers 2021
- Self-Checkout 178%
- Consumer Mobile Checkout 300%
- Contactless Payment 190%
- Electronic Shelf Labels 600%
- Dark Stores 900%
- Before listing out market reports, bear in mind that most of the reports will include supermarket and even ATM segments (e.g. NCR or Diebold Nixdorf). NCR is $40B company and does hybrid checkout “kiosks” for Walmart. The Kiosk Association report filtered out double-counting and non-relevant units.
- Market Reports (Pick your poison)
- The global interactive kiosk market size was valued at $14.76 billion in 2018, and is projected to reach $32.51 billion by 2027, growing at a CAGR of 9.1% from 2020 to 2027. [Allied]
- The global kiosk market is projected to grow from $22.69 billion in 2021 to $51.05 billion in 2028 at a CAGR of 12.3% in forecast period [2021-2028] [Fortune]
- The self-service kiosk market is US $11,319 million in 2019 and it is projected to reach US $21,415.4 million by 2027. [ResearchAndMarkets]
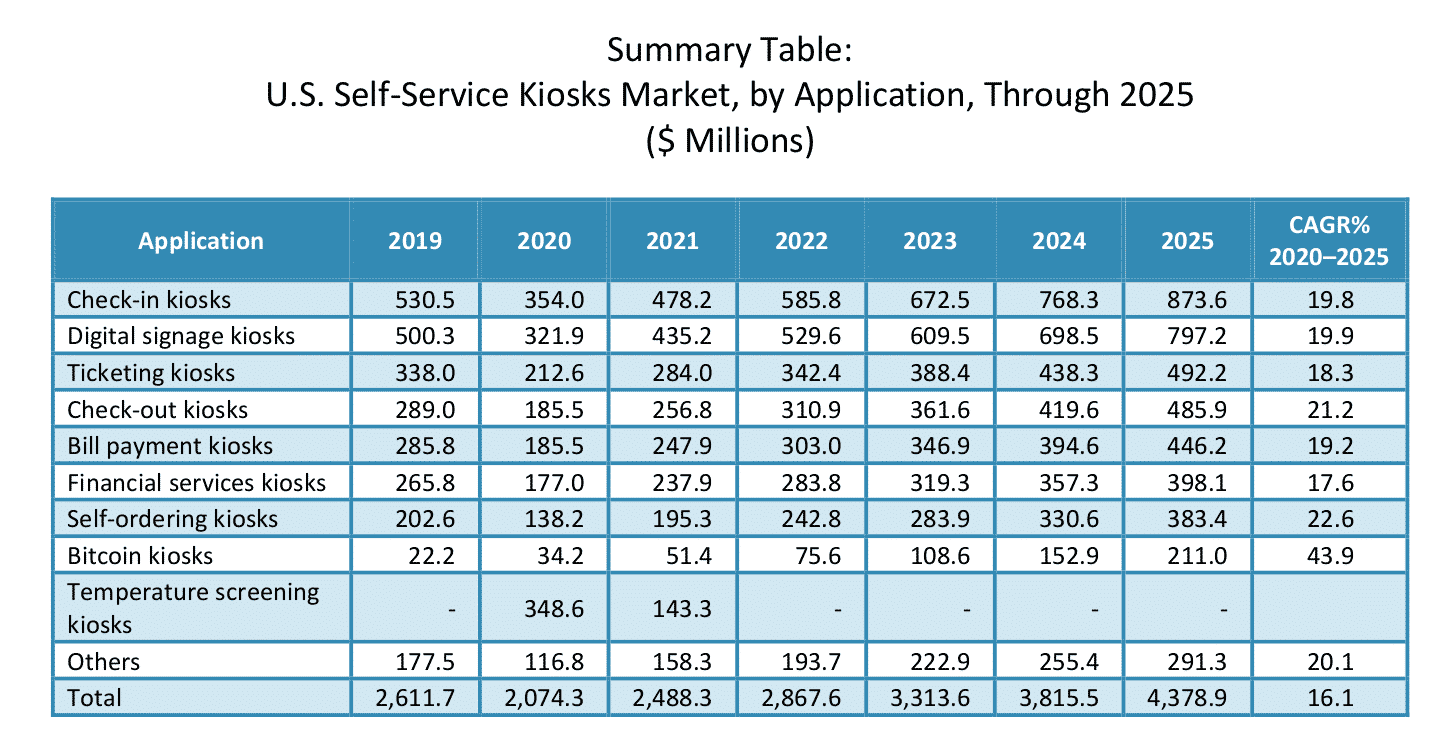
- The U.S market for self-service kiosks was valued at $2.6 billion in 2019. It is projected the self-service kiosks market in the U.S. will grow at a CAGR of 16.1% to reach $4.4 billion by 2025. [Kiosk Association 2019]
- The global Self Service Kiosk Market is estimated to surpass $35.8 billion mark by 2026 growing at an estimated CAGR of more than 6.4% [IndustryArc]
- The global interactive kiosk market size was valued at USD 26.63 billion in 2020 and is expected to expand at a compound annual growth rate (CAGR) of 6.9% from 2021 to 2028. [Grandview]
- Self-Service Kiosk Market Growth Sturdy at 8.6% CAGR to Outstrip $21B by 2027 [Insight Partners]
- The global interactive kiosk market size is expected to reach USD 45.32 billion by 2028. It is expected to expand at a CAGR of 6.9% from 2021 to 2028. [Report Linked]
- Here is story on Chick-Fil-A and virtual order takers in the drive thru (TikTok video) — link
- Canadian organizations are taking a broad, strategic view of their kiosk investments, saying the number one business driver is to support their digital transformation, with 77% saying the technology will be important or very important in the next five years. [CDN
Kiosk Related Data
- Square
- 73% of restaurants say they are experiencing a labor shortage.
- Restaurants say that an average of 21% of positions are unfilled.
- In 2021 36% of restaurants upgraded business technology this past year.
- 62% of restaurants say that automation would fill critical gaps in managing orders placed online, at the restaurant, and via delivery apps.
- Restaurants that offer online ordering say that an average of 34% of their revenue currently comes from those channels.
- 49% of restaurants say that they plan to offer first-party delivery, while 62% say that they plan to offer third-party delivery.
- Restaurants are able to turn tables faster, and recent Square data show that businesses average a 35% increase in sales within the first 30 days after they implement self-serve ordering with QR codes.
- 79% of customers say that they’d prefer to order via online kiosks rather than directly through staff — and not just for fast food.
- 45% of customers prefer it for casual dining
- 21% prefer it for fine dining.
- Payment Options: 29% of consumers prefer contactless payments such as mobile wallets, contactless payment kiosks, and QR code payments.
Signage related data
- Square
- 78% of customers say that there are benefits to digital menus.
- 11% of customers would avoid a restaurant with no digital menus.
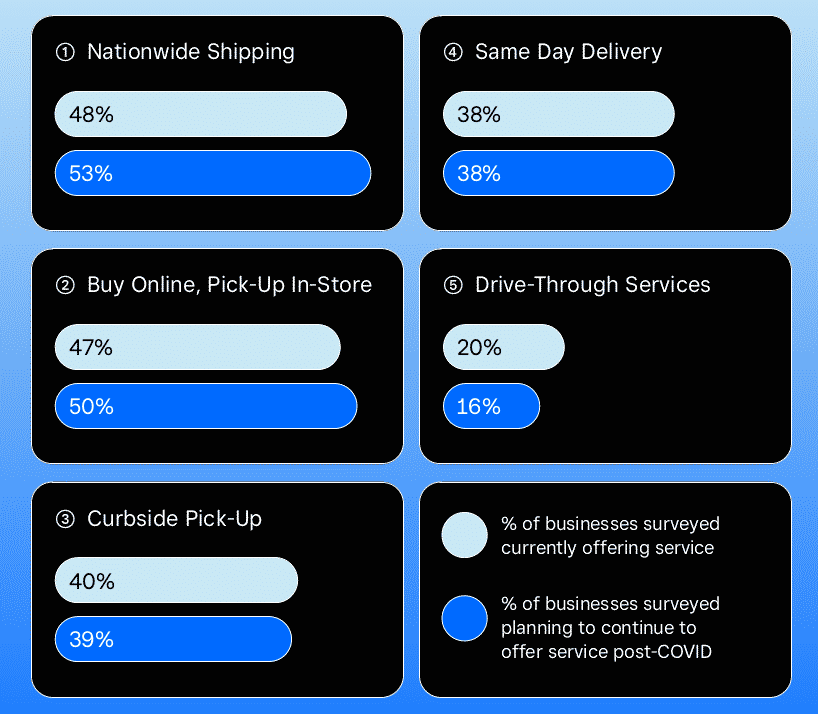
- 45% of restaurants say that they plan to offer QR code menus even after COVID subsides.
- Digital menus help communicate fluctuating prices and lessen the workload of printing new menus constantly. And 77% of customers say that they would understand if their favorite local restaurants raised prices.
Ordering related data
-
94% of restaurants surveyed say that they currently offer contactless payment options.
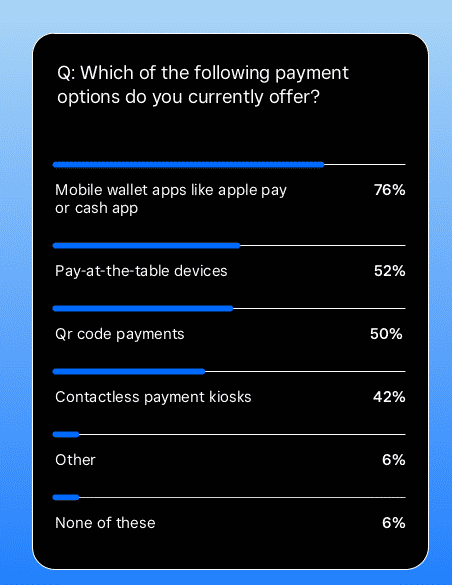
- Which of the following payment options do you currently offer?
- Mobile wallet apps like apple pay or cash app 76%
- Pay-at-the-table devices 52%
- Qr code payments 50%
- Contactless payment kiosks 42%
- Other 6%
- None of these 6%
- Additionally, 52% of restaurants surveyed say that they plan to offer tableside payment options.
- 43% of millennial and Gen Z diners prefer contactless payment methods.
- 29% of consumers prefer contactless payments such as mobile wallets, contactless payment kiosks, and QR code payments.
- 18% of customers say they are interested in shopping via text or chat; among Gen Z consumers, that number jumps to 25%.
- According to the 2021 Findings from the Diary of Consumer Payment Choice, cash use in the U.S. accounted for only 19 percent of all payments in 2020, 7 percent less than in 2019.
- Among customers, 20% are interested in window shopping with QR codes for purchases; among Millennials, that number jumps to 27%.
- POS data infographic by Datacap Systems is recommended for context
Retail Data
- 32% of retailers say that not knowing enough about technology options/ platforms keeps them from selling goods through newer online or social channels.
- 28% of retailers say they have seen customers purchasing gift cards over the past year.
- Retailers using eCommerce report that an average of 58% of their revenue currently comes from online sales.
- 84% of customers say measures put in place to make shopping a more contactless experience have made shopping more enjoyable.
- 18% of customers say they are interested in shopping via text or chat; among Gen Z consumers, that number jumps to 25%.
- Among retailers who sell online, 74% say they sell on a social channel.
- Facebook 59%
- Instagram 34%
- Twitter 28%
- TikTok 18%
- December 2021 — TikTok overtakes Google for 2021 Traffic Ratings [link]
- Among customers, 20% are interested in window shopping with QR codes for purchases; among Millennials, that number jumps to 27%.
- McKinsey – In total, self-checkout solutions in the Retail Environments setting could generate $430 billion to $520 billion in economic value in 2030, with more
than 80 percent of the value coming from cost reductions in the store and 20 percent from increased consumer surplus for shoppers, primarily from spending less time shopping. Adoption of self-checkout use cases is expected to increase from a relatively low 15 to 35 percent of organized retail today to 80 to 90 percent in 2030. - McKinsey – Retailers report that self-checkout is the fastest growing application of the IoT. Over the next two years, adoption by large retail chains of self-heckout
systems could exceed 50 percent. - US Retail has added more sales in 2021 than the entire retail economy for India. The growth…in 2021 through 11 months is $831b USD….for 2020, the entire retail economy for nearly 1.4b people was $814b USD for the year! The growth for November alone?…$91.1b USD…. That’s the total revenue for 2020 for Lowe’s…and just short of Target’s 2020 revenues just north of $93b. [IHL]
- Total retail growth year to year is 18.2%…that’s a $5.5 trillion market growing at 18.2% for the year. And for the month…20.3%. Even taking out C-stores and Gas Stations… the growth was 16.5%. The growth last month?…16.1%…so the growth is accelerating, not slowing. [IHL]
- Add to this that Gift Cards are up 414% for the holiday season and consumers generally spend 25% more than their gift card value when redeemed thus extending the holiday season. [IHL]
Telehealth Data
- The number of Medicare fee-for-service (FFS) beneficiary telehealth visits increased 63-fold in 2020, from approximately 840,000 in 2019 to nearly 52.7 million in 2020. [HHS]
- Visits to behavioral health specialists showed the largest increase in telehealth in 2020. Telehealth comprised a third of total visits to behavioral health specialists. [HHS]
More Data
- Among customers, 23% are interested in virtual reality that allows people to experience products in a virtual shop; among Millennials, that number jumps to 33%.
- 21% are interested in live stream shopping where a host demonstrates a product in a live online video; among Millennials, that number jumps to 35%.
- Strategy Analytics estimates that the sale of personal service robots will grow about 30 percent year over year, rising from 39 million units in 2020 to 146 million units in 2025.
- Livestreaming – Interest in this emerging retail channel is highest among global consumers between the ages of 21 and 34, peaking with the 30–34 age group with 46% having used this medium to make a purchase. As a nation, China is leading with 63% having made a purchase in the last month. Source: Euromonitor International Voice of Consumer: Digital Survey, fielded in March 2021 according to the Voice of the Consumer:Digital Survey.
References:
- The Square Consumer Survey was conducted by Wakefield Research among 1,000 nationally representative U.S. adults ages 18+, between October 6th and October 17th, 2021, using an email invitation and an online survey. The data was weighted to ensure reliable and accurate representation of the U.S. adult population, ages 18+. The Square Retail Survey was conducted by Wakefield Research among 500 U.S. retail owners and managers, between October 6th and October 17th, 2021, using an email invitation and an online survey.
- Forrester Research — Before we get into 2022, how accurate were we in 2021 predictions? [link]
- Who Got It Right in 2021 — A look back
- 2021 HHS medicare-telehealth-report
- IHL Retail Numbers December 2021
- Datacap Infographic
Related Kiosk Market Research Posts
- Kiosk Research – Global Self-Service Tech Market on the Rise(Opens in a new browser tab)
- Five Payment Trends in 2021 – Appetize Technologies(Opens in a new browser tab)
- The Do-It-Myself Generation | NACS Online(Opens in a new browser tab)
For more information contact craig@catareno.com or call 720-324-1837


