
Restaurant industry statistics can tell us how many locations opened, how much consumers spent and which technologies operators are deploying. But sometimes the most revealing numbers are the ones investors put real money behind.
As an avid investor as well as a longtime observer of restaurant and self-service technology, Craig Allen Keefner has found that market performance can provide a useful reality check on industry narratives. Stock prices aren’t perfect predictors, but they reflect actual capital being placed behind expectations for growth, margins, traffic, labor costs and competitive position.
That prompted us to create the TIG Restaurant 20 Equity Index (R20) — an equal-weighted basket of 20 publicly traded restaurant companies spanning limited service/QSR, fast casual/growth and casual/full service.
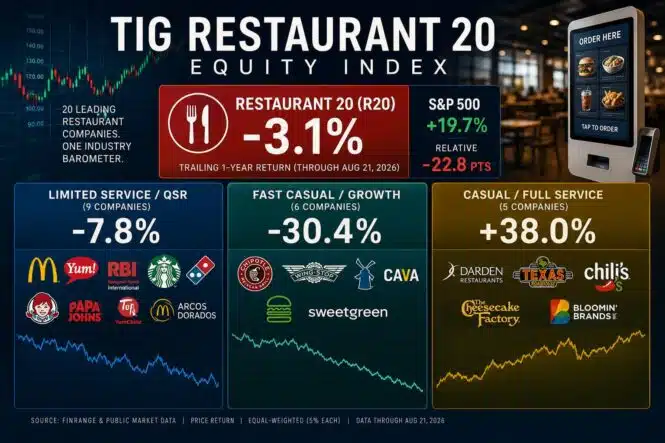
The results are particularly interesting because the restaurant industry isn’t moving as one market. The headline R20 number masks a striking divergence between restaurant segments.
Disclosure: Craig Allen Keefner is an individual investor and owns shares of McDonald’s (MCD). The TIG Restaurant 20 is an industry research indicator, not an investment recommendation. Individual holdings do not affect index membership or weighting. We will “freeze” this index for one year.
Summary August 22, 2026–
TIG Restaurant 20 Equity Index
R20: −3.1%
Limited Service 9: −7.8%
Fast Casual / Growth 6: −30.4%
Casual / Full Service 5: +38.0%
S&P 500: ~+20%
- R20 — TIG Restaurant 20 = equal weighted, 5% each
- Restaurant 20 YOY: −3.1% | S&P 500: +19.7% | Relative: −22.8 points
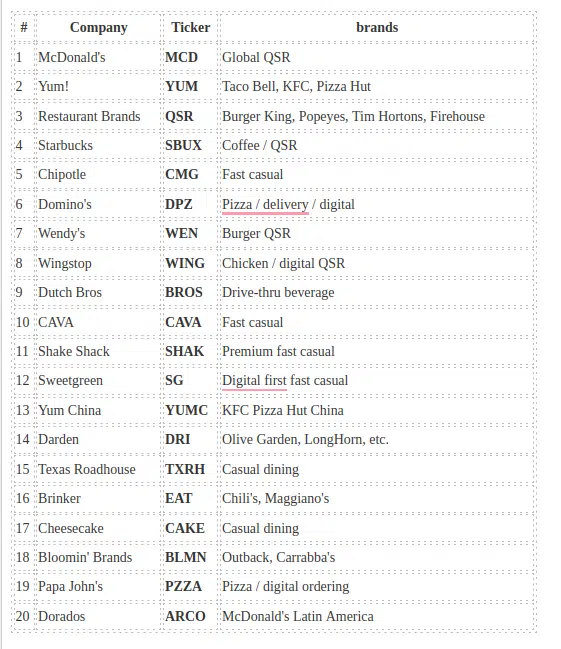
For a Restaurant / Fast-Food Equity 20, The Restaurant 20 does not simply track the 20 largest restaurant stocks. It is designed to represent businesses that matter to restaurant technology, self-service, digital ordering, drive-thru, labor automation and consumer spending. We will build it to represent the businesses that matter to restaurant technology, self-service, digital ordering, drive-thru, labor automation and consumer spending.
The TIG Restaurant 20:” or “R20 Index Constituents:
 Restaurant 20 — trailing one-year performance
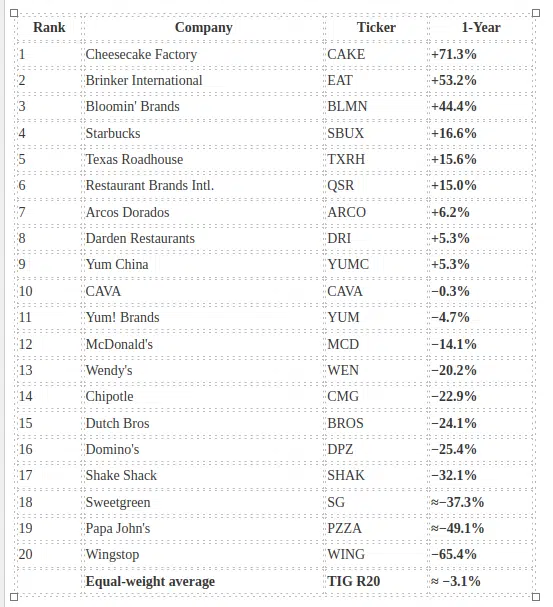 10 stocks are positive and 10 negative, yet the average is slightly negative. And the division isn’t simply “restaurants are doing badly.”
Casual dining has some enormous winners: Cheesecake Factory +71%, Brinker +53%, Bloomin’ +44%, Texas Roadhouse +16% and Darden +5%. Meanwhile many of the companies most associated with QSR, digital ordering and fast-casual growth have been hammered: Wingstop −65%, Papa John’s −49%, Sweetgreen −37%, Shake Shack −32%, Domino’s −25%, Dutch Bros −24%, Chipotle −23%, Wendy’s −20% and McDonald’s −14%.
Restaurant stocks aren’t moving together. Investors have sharply rewarded some traditional casual-dining operators while punishing many of the industry’s former high-growth QSR and fast-casual favorites.
R20 Performance by Restaurant Segment
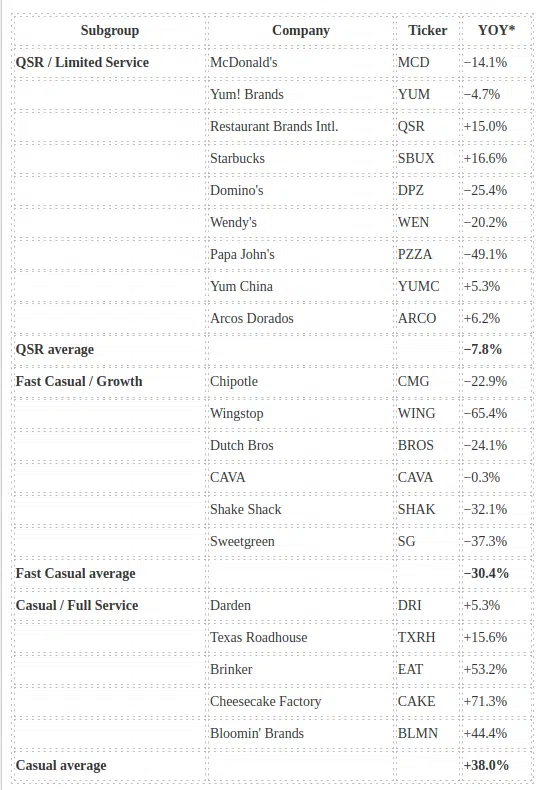 The Real Story: A 68-Point Restaurant Market Divide
R20 overall: ≈ −3.1%
QSR 9: ≈ −7.8%
Fast Casual/Growth 6: ≈ −30.4%
Casual Dining 5: ≈ +38.0%
So there’s almost a 68-percentage-point gap between Casual Dining and Fast Casual.
And that isn’t just an artifact of our stock selection. Barron’s recently calculated that a full-service basket outperformed fast-casual stocks by 48.7 percentage points over just 60 days through July 29. Yahoo Finance likewise found Darden, Texas Roadhouse, Brinker, Cheesecake Factory and BJ’s had produced a median gain of roughly 62% over the recent three-month period.
The operating results provide some support for the stock-market signal. Chili’s delivered its 20th consecutive quarter of same-store-sales growth in fiscal Q3, and Brinker subsequently reported FY2026 comparable restaurant sales up 8.1%. Meanwhile Wingstop’s Q2 domestic same-store sales fell 7.5%, even though its systemwide sales and unit count continued growing.
One classification deserves discussion: Starbucks. Technically we could put it into a “Beverage/Drive-Thru” group with Dutch Bros, but with only two companies that subgroup isn’t very meaningful. I’d leave Starbucks in limited service and Dutch Bros in growth.
R20 Methodology Notes.
- We include Yum China and Arcos Dorados. You’re measuring the restaurant/self-service industry, not just U.S. investor sentiment. YUMC alone is currently around a $16 billion company and generates roughly $12 billion in revenue.
- One important methodological choice: we don’t market-cap weight it. McDonald’s and Starbucks would overwhelm the signal. As of early August, MCD was roughly $196B versus Texas Roadhouse ~$14B and Domino’s ~$12B.
Deep Dive
Our Basis
- If the companies most associated with digital ordering, drive-thru innovation, and labor automation are the worst performers in the index, what does that say about how the market values restaurant technology — and are operators and vendors measuring the wrong things?
-
Winners and Losers
-
Cheesecake Factory (+71%): What tech (if any) are they deploying? Are they winning despite minimal automation, or because of it?
-
Wingstop (−65%): Their digital game is strong, so why is the stock down? Is digital now a commodity, not a differentiator?
-
- None of the five casual-dining outperformers has customer self-order kiosks or kitchen robotics. What they all deployed is a tabletop payment device — Outback at 691 of 691 stores with >85% tablet payment, Chili’s at ~94%, Olive Garden since 2015 at ~80% usage. Texas Roadhouse owns tablets capable of taking orders and deliberately leaves that off. Meanwhile the entire 2024–26 ledger of automation retreats sits in the losing basket: Sweetgreen selling the Infinite Kitchen to Wonder for a reported $186.4M and licensing it back, Starbucks halting Siren below 10% penetration, Chipotle’s Autocado pulled back, McDonald’s ArchIQ at five locations against $1.06B of capitalized software, Papa John’s $18.4M write-down.
- Sourcing is company IR, SEC filings, transcripts, BLS/CBO, and named trade press only; we drop the aggregator and content-farm hits the research surfaced. Unconfirmable figures are excluded and listed in the methodology note rather than estimated.
- R20 Why the Divide And Who Actually Deploys the Tech


