
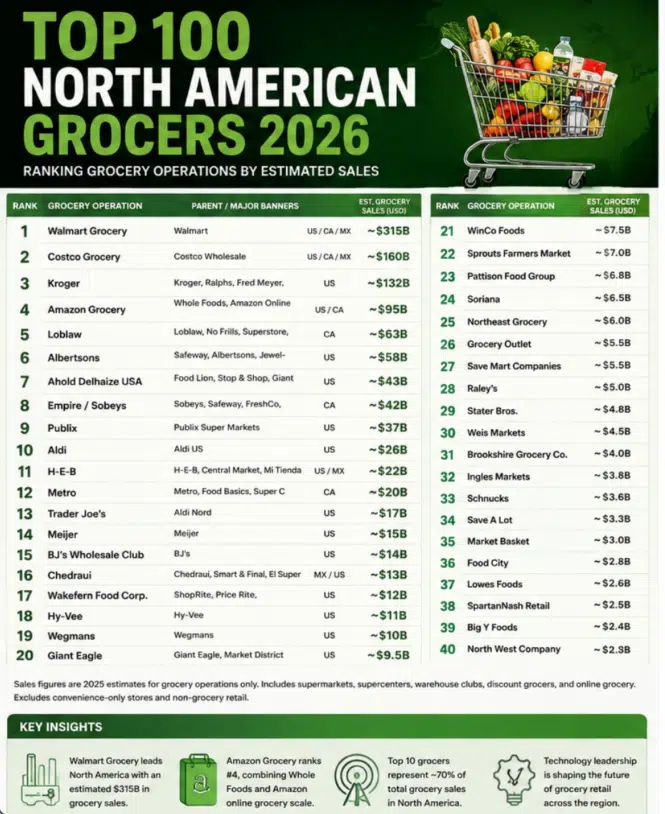
Ranking Grocery Operations by Market Scale, Workforce Technology and Customer Technology
Who are North America’s leading grocery retailers — and which are making the best use of technology?
The TIG Top 100 North American Grocers 2026 examines grocery operations across the United States, Canada and Mexico.
Unlike conventional retail rankings, this index does not automatically rank a company according to its total corporate revenue.
That distinction matters.
Amazon is one of the world’s largest retailers, but Amazon’s total retail revenue is not grocery revenue. Walmart sells hundreds of billions of dollars of merchandise outside grocery. Costco combines grocery with general merchandise, pharmacy, fuel and other businesses.
Here is how Progressive Grocer saw things in 2022. We see five structural changes:
- Consolidation. C&S + SpartanNash is the obvious example.
- Discount ascendance. Aldi, Costco, Walmart and value-oriented formats have become even more strategically important.
- Casualties. Rite Aid and 99 Cents Only demonstrate that scale alone didn’t guarantee survival.
- Format convergence. Grocery, club, convenience, dollar, pharmacy and e-commerce increasingly overlap—but that makes defining “grocer” more important, not less.
- Technology differentiation. This is where our new ranking can be much more valuable than the 2022 list. The old ranking basically asks who sells the most. Our 2026 version can also answer who is technologically best positioned.
- That means our Workforce Technology Grade and Customer Technology Grade becomes genuinely interesting. Walmart, Kroger, Sam’s Club, Costco, Aldi, H-E-B, Publix and regional operators can look very different when measured on self-checkout, Scan & Go, computer vision, electronic shelf labels, retail media, workforce mobility, AI, robotics, digital signage and fulfillment.
For this vertical ranking, grocery means grocery.
The Vertical Revenue Rule
TIG uses the following methodology for its vertical-market rankings:
Revenue or sales attributable to the market being ranked are used whenever reasonably available or estimable. Consolidated parent-company revenue is not substituted for vertical revenue when the parent operates substantial businesses outside the category. Estimates are identified as such.
This means:
Amazon Grocery is evaluated using Whole Foods Market, Amazon’s grocery e-commerce operations and other identifiable grocery activities — not Amazon’s total retail sales.
Walmart Grocery uses the grocery portion of Walmart’s business rather than automatically treating every Walmart sale as grocery.
Costco Grocery similarly considers food, sundries and fresh-food operations rather than assuming every warehouse-club sale is grocery.
The same principle applies throughout the ranking.
What Qualifies as Grocery?
The index includes businesses substantially engaged in selling food and grocery products directly to consumers.
Formats can include:
- Supermarkets
- Supercenters
- Warehouse clubs
- Discount grocery
- Natural and specialty grocery
- Ethnic/international supermarkets
- Online grocery
- Selected convenience formats with substantial grocery operations
Restaurant chains are excluded.
Drugstores are generally excluded unless grocery becomes a sufficiently substantial component to justify inclusion.
Pure wholesalers are excluded except where the organization also operates a meaningful consumer-facing grocery network.
Parent Companies and Banners
The index distinguishes between a grocery operation and its corporate parent.
For example:
Whole Foods Market / Amazon Grocery — Amazon
Sam’s Club — Walmart
Trader Joe’s — Aldi Nord
T&T Supermarket — Loblaw
Farm Boy — Empire
Smart & Final / El Super — Chedraui
Subsidiaries and banners should not automatically receive separate positions simply to increase the number of entries.
However, TIG may identify significant banners within a parent company’s profile when their technology, format or market strategy is materially different.
2026 Working North American Grocery Ranking
The following is the revised working order. Final sales ordering will continue to be refined as grocery-specific revenue and comparable 2025 data are verified.
| Working Rank | Grocery Operation | Parent / Major Banners | Primary Market | Workforce Tech | Customer Tech |
|---|---|---|---|---|---|
| 1 | Walmart Grocery | Walmart | US / CA / MX | A+ | A+ |
| 2 | Costco Grocery | Costco Wholesale | US / CA / MX | B+ | B+ |
| 3 | Kroger | Kroger, Ralphs, Fred Meyer, Harris Teeter, King Soopers, etc. | US | A | A |
| 4 | Amazon Grocery | Whole Foods Market, Amazon online grocery | US / CA | A+ | A+ |
| 5 | Loblaw | Loblaw, No Frills, Real Canadian Superstore, T&T, Shoppers grocery | Canada | A | A |
| 6 | Albertsons | Safeway, Albertsons, Jewel-Osco, Shaw’s, Acme, Vons, etc. | US | A- | A- |
| 7 | Ahold Delhaize USA | Food Lion, Stop & Shop, Giant, Hannaford | US | A | A- |
| 8 | Empire / Sobeys | Sobeys, Safeway Canada, FreshCo, Farm Boy, IGA | Canada | A | A |
| 9 | Publix | Publix Super Markets | US | B+ | A- |
| 10 | Aldi | Aldi U.S. | US | B+ | B+ |
| 11 | H-E-B | H-E-B, Central Market, Mi Tienda | US / MX | A | A |
| 12 | Metro | Metro, Food Basics, Super C | Canada | A- | A- |
| 13 | Trader Joe’s | Aldi Nord | US | B | B |
| 14 | Meijer | Meijer | US | A- | A- |
| 15 | BJ’s Wholesale Club | BJ’s | US | A- | A- |
| 16 | Chedraui | Chedraui, Smart & Final, El Super | MX / US | A- | A- |
| 17 | Wakefern | ShopRite, Price Rite, The Fresh Grocer | US | B+ | A- |
| 18 | Hy-Vee | Hy-Vee | US | A- | A |
| 19 | Wegmans | Wegmans | US | B+ | A- |
| 20 | Giant Eagle | Giant Eagle, Market District | US | A- | A- |
| 21 | WinCo Foods | WinCo | US | B+ | B+ |
| 22 | Sprouts Farmers Market | Sprouts | US | A- | A- |
| 23 | Pattison Food Group | Save-On-Foods, Buy-Low and others | Canada | B+ | B+ |
| 24 | Soriana | Soriana | Mexico | B+ | B+ |
| 25 | Northeast Grocery | Price Chopper/Market 32, Tops | US | B+ | B+ |
| 26 | Grocery Outlet | Grocery Outlet | US | B+ | B |
| 27 | Save Mart Companies | Save Mart, Lucky California, FoodMaxx | US | B | B+ |
| 28 | Raley’s | Raley’s, Bel Air, Nob Hill, Bashas’ | US | B+ | B+ |
| 29 | Stater Bros. | Stater Bros. | US | B | B+ |
| 30 | Weis Markets | Weis | US | B+ | B+ |
| 31 | Brookshire Grocery | Brookshire’s, Super 1 Foods, Fresh | US | B+ | B+ |
| 32 | Ingles Markets | Ingles | US | B | B |
| 33 | Schnucks | Schnucks | US | A- | A- |
| 34 | Save A Lot | Save A Lot | US | B | B |
| 35 | Market Basket | Demoulas | US | C+ | C+ |
| 36 | Food City | K-VA-T Food Stores | US | B+ | B+ |
| 37 | Lowes Foods | Alex Lee | US | B+ | A- |
| 38 | SpartanNash Retail | Family Fare and other banners | US | B+ | B+ |
| 39 | Big Y | Big Y Foods | US | B+ | B+ |
| 40 | North West Company | Northern, NorthMart and others | Canada | B | B |
| 41 | Coborn’s | Coborn’s, Cash Wise and others | US | B+ | B+ |
| 42 | Rouses Markets | Rouses | US | B | B+ |
| 43 | Festival Foods | Festival | US | B+ | B+ |
| 44 | Woodman’s Markets | Woodman’s | US | B+ | A- |
| 45 | Fareway | Fareway | US | B | B |
| 46 | Brookshire Brothers | Brookshire Brothers | US | B | B |
| 47 | Harmons | Harmons | US | B+ | B+ |
| 48 | The Fresh Market | The Fresh Market | US | B+ | B+ |
| 49 | Natural Grocers | Natural Grocers | US | B | B |
| 50 | Village Super Market | ShopRite operator | US | B+ | B+ |
| 51 | H Mart | H Mart | US / CA | B+ | B+ |
| 52 | Heritage Grocers Group | Cardenas, Tony’s Fresh Market, El Rancho | US | B+ | B+ |
| 53 | Key Food Stores | Key Food and affiliated banners | US | B | B+ |
| 54 | Vallarta Supermarkets | Vallarta | US | B | B+ |
| 55 | Northgate González Market | Northgate | US | B+ | B+ |
| 56 | 99 Ranch Market | Tawa Supermarket | US | B+ | B+ |
| 57 | Sedano’s | Sedano’s | US | B | B |
| 58 | La Michoacana Meat Market | La Michoacana | US | B | B |
| 59 | Gelson’s Markets | Gelson’s | US | B+ | B+ |
| 60 | Good Food Holdings | Bristol Farms, New Seasons, Metropolitan Market | US | B+ | A- |
| 61 | Nugget Markets | Nugget | US | B+ | B+ |
| 62 | Lunds & Byerlys | Lunds & Byerlys | US | B+ | A- |
| 63 | Heinen’s | Heinen’s | US | B+ | A- |
| 64 | Fresh Thyme Market | Fresh Thyme | US | B+ | B+ |
| 65 | Food Bazaar | Bogopa | US | B+ | B+ |
| 66 | Uncle Giuseppe’s | Uncle Giuseppe’s Marketplace | US | B+ | B+ |
| 67 | DeCicco & Sons | DeCicco & Sons | US | B+ | A- |
| 68 | PCC Community Markets | PCC | US | B+ | B+ |
| 69 | Redner’s Markets | Redner’s | US | B | B+ |
| 70 | Pete’s Fresh Market | Pete’s | US | B | B+ |
| 71 | La Comer | La Comer, Fresko, City Market | Mexico | B+ | B+ |
| 72 | Casa Ley | Casa Ley | Mexico | B | B |
| 73 | Calimax | Calimax | Mexico | B | B+ |
| 74 | Merco | Merco | Mexico | B | B |
| 75 | Calgary Co-op | Calgary Co-op | Canada | B+ | B+ |
| 76 | Federated Co-operatives Retail | Co-op grocery network | Canada | B+ | B+ |
| 77 | Longo’s | Empire | Canada | A- | A- |
| 78 | Dorothy Lane Market | Dorothy Lane Market | US | B+ | A- |
| 79 | Gerrity’s | Gerrity’s | US | B | B |
| 80 | Lowe’s Markets | Lowe’s Markets | US | B | B |
| 81 | Marc’s | Marc’s | US | B | B |
| 82 | Super King Markets | Super King | US | B | B |
| 83 | Lassens | Lassens Natural Foods | US | B | B |
| 84 | Mother’s Market | Mother’s Market | US | B | B+ |
| 85 | New Leaf Community Markets | New Leaf | US | B | B+ |
| 86 | Super A Foods | Super A | US | B- | B- |
| 87 | Gristedes / D’Agostino | Red Apple Group | US | B- | B- |
| 88 | Weavers Way | Weavers Way Co-op | US | B | B |
| 89 | Giant Tiger Grocery | Giant Tiger | Canada | B | B |
| 90 | S-Mart | S-Mart | Mexico | B | B |
| 91 | Supermercados Morelos | Morelos | Mexico | B | B |
| 92 | Supermercados El Rancho | Regional grocery operation | Mexico | B | B |
| 93 | Supermercados González | Regional grocery operation | Mexico | B | B |
| 94 | Pete’s Market / regional independent group | Regional grocery | US | B | B |
| 95 | Berkeley Bowl | Berkeley Bowl | US | B | B |
| 96 | Draeger’s Market | Draeger’s | US | B | B |
| 97 | Mollie Stone’s Markets | Mollie Stone’s | US | B | B+ |
| 98 | Oliver’s Market | Oliver’s | US | B | B |
| 99 | Kowalski’s Markets | Kowalski’s | US | B+ | B+ |
| 100 | Jungle Jim’s International Market | Jungle Jim’s | US | B | B+ |
A Separate Convenience Grocery List
One important change from the first draft is the removal of major convenience-store companies such as OXXO, 7-Eleven and Circle K from the primary supermarket ranking.
They are unquestionably important food retailers and extremely important technology operators.
But their business model differs enough from supermarkets that including them can distort comparisons.
TIG therefore intends to create a companion category:
Top North American Convenience & Foodservice Retailers
That category can evaluate companies such as:
- 7-Eleven
- OXXO
- Circle K
- Casey’s
- Wawa
- Sheetz
- QuikTrip
- RaceTrac
- Murphy USA
That comparison should be particularly interesting for self-service, payments, digital menu boards, food ordering, loyalty, AI and unattended retail.
Technology Methodology
Workforce Technology
The TIG Workforce Technology Grade considers:
- Associate mobile technology
- Task and workforce management
- Inventory visibility
- RFID
- Computer vision
- Analytics
- Forecasting
- AI
- Pricing and merchandising
- Warehouse automation
- Fulfillment
- Robotics
- Supply-chain technology
- Remote monitoring and management
- Deployment scale
The central question is:
How effectively does technology enable employees and improve grocery operations?
Customer Technology
The TIG Customer Technology Grade considers:
- Self-checkout
- Kiosks
- Mobile applications
- Digital grocery
- Loyalty
- Personalization
- Digital payments
- Electronic shelf labels
- Digital signage
- Smart carts
- Product lookup
- Pickup and curbside
- Lockers
- Delivery
- Customer-facing AI
- Accessibility
- Inclusive UX
- Deployment scale
The question isn’t how many technologies a retailer has purchased.
It is:
How effectively does deployed technology improve the customer experience?
Amazon Illustrates Why the Methodology Matters
Amazon Grocery is one of the most interesting companies in this study precisely because conventional retail revenue doesn’t adequately describe it.
Amazon operates Whole Foods Market while simultaneously selling enormous quantities of grocery and consumable products through Amazon.com.
Its online grocery business overlaps with fulfillment, Prime, Same-Day Delivery, AI, personalization and Amazon’s enormous logistics infrastructure.
At the same time, Amazon has experimented aggressively with physical grocery concepts.
In 2026 Amazon announced that it would close its Amazon Fresh and Amazon Go physical stores while expanding Whole Foods Market and continuing to experiment with new grocery formats.
That isn’t necessarily a technology retreat.
It demonstrates an important distinction this index is designed to capture:
Technology experimentation and successful retail deployment aren’t the same thing.
Amazon’s willingness to abandon formats that don’t achieve the required economics may itself be evidence of technology maturity.
Our preliminary assessment remains:
Amazon Grocery — Workforce A+ / Customer A+.
Walmart Grocery Is Different From Walmart
Walmart presents the opposite measurement problem.
Walmart is unquestionably a grocery company, but it is not exclusively a grocery company.
Its stores sell apparel, electronics, home goods, pharmacy products and many other categories.
Therefore TIG does not simply take Walmart corporate revenue and call it grocery revenue.
The grocery component is evaluated independently wherever sufficient reporting exists.
From a technology standpoint, however, Walmart remains the benchmark for large-scale physical grocery technology.
Its challenge is extraordinary:
deploying associate technology, inventory systems, fulfillment, pickup, delivery, self-checkout, mobile applications, payments, computer vision, automation and AI across thousands of physical stores.
Walmart Grocery — Workforce A+ / Customer A+.
Costco Requires the Same Treatment
Costco is another excellent example of the Vertical Revenue Rule.
A Costco warehouse sells grocery, fresh food and consumables alongside appliances, jewelry, electronics, furniture, tires, gasoline and many other categories.
Total Costco sales therefore should not automatically be treated as grocery revenue.
Food and fresh-food sales should be isolated wherever the company’s reporting allows it.
Costco is also an important technology counterexample.
Its success doesn’t depend upon deploying the maximum amount of customer-facing technology.
Operational discipline and a deliberately simplified membership model remain fundamental advantages.
Costco Grocery — Workforce B+ / Customer B+.
Grocery Technology Is About People Too
The TIG grading system also rejects the simplistic assumption that retail technology maturity means eliminating employees.
Grocery technology increasingly serves two simultaneous objectives:
Make employees more effective.
Make shopping easier for customers.
That is why the TIG index publishes separate Workforce and Customer grades.
A highly automated fulfillment center might dramatically improve employee productivity without ever being seen by a shopper.
Conversely, a sophisticated mobile loyalty application might improve the customer experience without materially changing store labor.
Both are retail technology.
Accessibility Is Customer Technology
Accessibility is incorporated directly into the Customer Technology Grade.
A self-checkout system, kiosk, mobile application, payment device or pickup system cannot represent best-in-class customer technology if significant groups of customers cannot use it independently.
TIG therefore considers accessibility and inclusive UX characteristics alongside convenience, speed and personalization.
Deployment Beats Pilots
TIG places greater weight on deployed technology than announcements.
A technology deployed across 500 stores carries more weight than a sophisticated proof of concept in three locations.
Evidence can include:
- Number of stores
- Number of devices
- Production deployment dates
- Technology partners
- Customer adoption
- Employee adoption
- Operational results
- Accessibility
- Reliability
- Integration
- Expansion plans
This distinction will become increasingly important as retailers announce more AI initiatives.
An AI press release is not an AI deployment.
Remote Management Becomes a Measure of Maturity
Modern grocery stores increasingly resemble distributed technology environments.
A single location may contain POS terminals, self-checkouts, scales, kiosks, payment terminals, handheld computers, printers, digital menu boards, electronic shelf labels, lockers, cameras, sensors and network equipment.
Installing these systems is only half the problem.
Retailers must know whether they are working.
Remote monitoring, device management, observability, software management, security and predictive maintenance therefore increasingly belong in any serious assessment of grocery technology maturity.
A dead screen is not digital transformation.
Neither is an unavailable kiosk or a self-checkout that constantly requires an employee intervention.
Historical Look — 2022 PG list
The PG 100
|
Rank |
Company |
Fiscal Year |
Prior Year |
% Change |
Store Count |
Top Executives |
|
1 |
$393,247 |
$369,963 |
6.29% |
4,742 |
John Furner, President and CEO |
|
|
2 |
Amazon (Online and physical stores) |
$239,150 |
$213,573 |
11.98% |
662 |
Andrew R. Jassy, CEO |
|
3 |
Costco (U.S.) |
$141,398 |
$122,142 |
15.77% |
564 |
Craig Jelinek, President and CEO |
|
4 |
$137,888 |
$132,498 |
4.07% |
2,726 |
Rodney McMullen, Chairman and CEO |
|
|
5 |
Walgreens Boots Alliance (U.S retail) |
$112,005 |
$107,701 |
4.00% |
8,965 |
Rosalind Brewer, CEO |
|
6 |
$106,005 |
$93,561 |
13.30% |
1,926 |
Brian Cornell, Chairman and CEO |
|
|
7 |
$100,105 |
$91,198 |
9.77% |
9,939 |
Karen Lynch, President and CEO |
|
|
8 |
Sam’s Club (U.S.) |
$73,556 |
$63,910 |
15.09% |
600 |
Kathryn McLay, President and CEO |
|
9 |
$71,887 |
$69,690 |
3.15% |
2,278 |
Vivek Sankaran, President and CEO |
|
|
10 |
$53,699 |
$51,838 |
3.59% |
2,048 |
Kevin Holt, CEO |
|
|
11 |
$52,269 |
$51,859 |
0.79% |
2,439 |
Galen Weston, Executive Chairman |
|
|
12 |
$47,997 |
$44,864 |
6.98% |
1,293 |
Randall T. Jones Sr., CEO |
|
|
13 |
7-Eleven Inc. (U.S. only) |
$41,034 |
$17,801 |
130.52% |
12,973 |
Joe DePinto, CEO |
|
14 |
$35,964 |
$32,642 |
10.18% |
2,755 |
Guilherme Loureiro, President and CEO |
|
|
15 |
$34,200 |
$33,746 |
1.35% |
18,130 |
Todd Vasos, Chairman and CEO |
|
|
16 |
$34,000 |
$31,800 |
6.92% |
420 |
Charles Butt, Chairman and CEO |
|
|
17 |
$33,022 |
$31,450 |
5.00% |
7,700 |
Bob Palmer, CEO |
|
|
18 |
Alimentation Couche-Tard (U.S., Circle K) |
$31,128 |
$37,843 |
-17.74% |
7,076 |
Brian Hannasch, President and CEO |
|
19 |
Costco (Canada) |
$27,298 |
$24,434 |
11.72% |
105 |
Pierre Riel, EVP/COO, Costco International |
|
20 |
$25,457 |
$24,157 |
5.38% |
258 |
Rick Keyes, President and CEO |
|
|
21 |
$24,568 |
$24,043 |
2.18% |
2,451 |
Heyward Donigan, President and CEO |
|
|
22 |
Empire Company Ltd. (Sobeys) |
$22,394 |
$21,063 |
6.32% |
1,547 |
Michael Medline, President and CEO |
|
23 |
$21,773 |
$19,991 |
8.91% |
408 |
Horacio Barbeito, President and CEO |
|
|
24 |
$18,200 |
$17,056 |
6.71% |
2166 |
Jason Hart, CEO |
|
|
25 |
$17,800 |
$18,300 |
-2.73% |
362 |
Joe Colalillo, Chairman and CEO |
|
|
26 |
$16,306 |
$15,096 |
8.02% |
226 |
Bob Eddy, President and CEO |
|
|
27 |
$14,900 |
$14,100 |
5.67% |
530 |
Dan Bane, Chairman and CEO |
|
|
28 |
Metro (Canada) |
$14,486 |
$13,453 |
7.68% |
1,612 |
Eric R. La Fleche, President and CEO |
|
29 |
Dollar Tree (Including Family Dollar) |
$13,922 |
$13,265 |
4.95% |
16,077 |
Michael Witynski, President and CEO |
|
30 |
$12,300 |
$11,150 |
10.31% |
285 |
Randy Edeker, Chairman and CEO |
|
|
31 |
EG America (C-stores) |
$12,254 |
$11,425 |
7.26% |
1,698 |
George Fournier, President |
|
32 |
$11,900 |
$10,568 |
12.60% |
965 |
Chris Gheysens, President and CEO |
|
|
33 |
$11,300 |
$10,709 |
5.52% |
922 |
Chet Cadieux, CEO |
|
|
34 |
$11,200 |
$10,695 |
4.72% |
106 |
Colleen Wegman, President and CEO |
|
|
35 |
$10,812 |
$10,634 |
1.67% |
3,200 |
Dave Smith, President and CEO |
|
|
36 |
$10,600 |
$9,850 |
7.61% |
488 |
Laura Karet, CEO |
|
|
37 |
$9,907 |
$9,175 |
7.98% |
2,365 |
Darren Rebelez, CEO |
|
|
38 |
$9,600 |
$9,350 |
2.67% |
552 |
Max McBrayer, CEO |
|
|
39 |
$9,600 |
$8,033 |
19.51% |
419 |
Anthony Hucker, President and CEO |
|
|
40 |
Grupo Comercial Chedraui (U.S. and Mexico) |
$9,483 |
$7,275 |
30.35% |
579 |
Jose Antonio Chedraui Eguia, CEO |
|
41 |
$8,900 |
$9,348 |
-4.79% |
156 |
Tony Sarsam, President and CEO |
|
|
42 |
Costco (Mexico) |
$8,895 |
$8,180 |
8.74% |
39 |
Jaime Gonzalez, SVP/Country Mgr. Mexico |
|
43 |
$8,206 |
$7,618 |
7.72% |
810 |
Ricardo Martin Bringas, CEO |
|
|
44 |
$8,120 |
$7,594 |
6.93% |
293 |
Frank Curci, Chairman and CEO |
|
|
45 |
$8,100 |
$7,795 |
3.91% |
131 |
Grant Haag, CEO |
|
|
46 |
$7,417 |
$4,010 |
84.96% |
1,406 |
Ari Kotler, President and CEO |
|
|
47 |
$7,200 |
$5,600 |
28.57% |
630 |
Joseph Sheetz, CEO |
|
|
48 |
$6,750 |
$6,356 |
6.20% |
242 |
Keith Knopf, President and CEO |
|
|
49 |
United Natural Foods Inc. (Independent sales only) |
$6,638 |
$6,699 |
-0.91% |
N/A |
Steven Spinner, Chairman and CEO |
|
50 |
$6,527 |
$4,053 |
61.04% |
0 |
Dominik Richter, CEO |
|
|
51 |
Demoulas Super Markets Inc. (Market Basket) |
$6,200 |
$5,600 |
10.71% |
87 |
Arthur Demoulas, President and CEO |
|
52 |
$6,150 |
$6,199 |
-0.79% |
1,431 |
Bruce Thorn, President and CEO |
|
|
53 |
$6,099 |
$6,468 |
-5.71% |
374 |
Jack Sinclair, CEO |
|
|
54 |
Alimentation Couche-Tard |
$6,085 |
$6,739 |
-9.70% |
2111 |
Brian Hannasch, President and CEO |
|
55 |
$5,600 |
$5,250 |
6.67% |
204 |
Shane Sampson, Executive Chairman |
|
|
56 |
H-E-B (Mexico) |
$5,300 |
$5,184 |
2.24% |
71 |
Fernando Martinez, Director General |
|
57 |
$5,289 |
$5,142 |
2.86% |
181 |
Darrell Jones, President |
|
|
58 |
$4,988 |
$4,610 |
8.20% |
198 |
James Lanning, President and CEO |
|
|
59 |
$4,700 |
$5,119 |
-8.19% |
170 |
Pete Van Helden, CEO |
|
|
60 |
$4,700 |
$4,175 |
12.57% |
900 |
Leon Bergmann, CEO |
|
|
61 |
$4,224 |
$4,112 |
2.72% |
196 |
Jonathan Weis, Chairman, President and CEO |
|
|
62 |
Defense Commissary Agency (DeCA) |
$4,000 |
$3,900 |
2.56% |
177 |
Bill Moore, Director and CEO |
|
63 |
$3,800 |
$3,714 |
2.32% |
180 |
Brad Brookshire, Chairman and CEO |
|
|
64 |
$3,600 |
$3,450 |
4.35% |
112 |
Todd Schnuck, Chairman and CEO |
|
|
65 |
Alex Lee Inc. (Lowes Foods) |
$3,500 |
$3,350 |
4.48% |
80 |
Brian George, President and CEO |
|
66 |
$3,430 |
$3,150 |
8.89% |
1,421 |
Neil Rossy, President and CEO |
|
|
67 |
$3,400 |
$2,759 |
23.23% |
150 |
John Alston, President and CEO |
|
|
68 |
K-VA-T Food Stores Inc. (Food City) |
$3,100 |
$2,968 |
4.45% |
136 |
Steven C. Smith, CEO |
|
69 |
$3,100 |
$2,700 |
14.81% |
265 |
Dean Janeway, CEO |
|
|
70 |
$3,079 |
$3,134 |
-1.75% |
415 |
Eric Lindberg, CEO |
|
|
71 |
$2,935 |
$2,700 |
8.70% |
391 |
Barry Feld, CEO |
|
|
72 |
$2,890 |
$2,400 |
20.42% |
425 |
Dion Houchins, Chairman and CEO |
|
|
73 |
$2,800 |
$2,620 |
6.87% |
403 |
Robert Obray, President and CEO |
|
|
74 |
Giant Tiger (Canada) |
$2,515 |
$2,350 |
7.02% |
260 |
Paul Wood, President and COO |
|
75 |
$2,500 |
$2,466 |
1.38% |
84 |
Charles D’Amour, President and CEO |
|
|
76 |
Bozzuto’s Inc (Wholesale) |
$2,400 |
$2,300 |
4.35% |
N/A |
Michael Bozzuto, President and CEO |
|
77 |
$2,345 |
$2,166 |
8.26% |
129 |
Reynolds Cramer, President and CEO |
|
|
78 |
$2,100 |
$1,887 |
11.29% |
159 |
Jason Potter, CEO |
|
|
79 |
$2,000 |
$1,000 |
100.00% |
0 |
Yakir Gola, Co-Founder and CEO |
|
|
80 |
$1,800 |
$1,519 |
18.50% |
19 |
Phil Woodman, President |
|
|
81 |
$1,800 |
$ 1,455 |
23.71% |
99 |
Il Yeon Kwon, Founder and CEO |
|
|
82 |
$1,623 |
$1,511 |
7.41% |
120 |
Chris Coborn, President and CEO |
|
|
83 |
$1,600 |
$1,387 |
15.36% |
65 |
Donny Rouse, CEO |
|
|
84 |
$1,590 |
$1,464 |
8.61% |
146 |
Roger Lowe Jr., CEO |
|
|
85 |
$1,530 |
$1,353 |
13.08% |
61 |
Marc Glassman, Chairman |
|
|
86 |
$1,512 |
$1,458 |
3.70% |
29 |
Robert Sumas, CEO |
|
|
87 |
$ 1,498 |
$ 1,311 |
14.26% |
52 |
Enrique Gonzalez Jr., President and CEO |
|
|
88 |
$1,387 |
$1,299 |
6.77% |
54 |
Alice Chen, CEO |
|
|
89 |
$1,275 |
$1,025 |
24.39% |
170 |
Michal Lagunionek, President and CEO |
|
|
90 |
$1,254 |
$1,135 |
10.48% |
35 |
Agustin Herran, President and CEO |
|
|
91 |
$1,204 |
$1,007 |
19.56% |
70 |
Gerald Melville, President |
|
|
92 |
$1,200 |
$1,155 |
3.90% |
130 |
Rafael Ortega, President |
|
|
93 |
$1,100 |
$940 |
17.02% |
39 |
Mark Skogen, CEO |
|
|
94 |
$1,075 |
$965 |
11.40% |
47 |
Mimi Song, President and CEO |
|
|
95 |
$ 1,055 |
$1,036 |
1.83% |
162 |
Kemper Isley, Chairman, Director |
|
|
96 |
$845 |
$711 |
18.85% |
41 |
Miguel Gonzalez Reynoso, President and CEO |
|
|
97 |
$ 43 |
$699 |
6.29% |
1,165 |
Macedonio Garza Hernandez, CEO |
|
|
98 |
$576 |
$307 |
87.62% |
54 |
Talashi Patel, Co-Founder |
|
|
99 |
$470 |
$461 |
1.95% |
0 |
Linda Findley, CEO |
|
|
100 |
$452 |
$420 |
7.62% |
315 |
Andy O’Brien, CEO |
|
|
Total |
$2,275,651 |
|
11.00% |
|
||
A Living Index
The TIG Top 100 North American Grocers is intended to become an annual research project.
The 2026 edition establishes the baseline.
Future editions can track:
Grocery Sales
Store Count
Workforce Technology Grade
Customer Technology Grade
Technology Basis
Key Technology Partners
Major Deployments
Accessibility
Year-over-Year Grade Change
Over time, the changes may become more valuable than the absolute ranking.
The objective is not simply to identify who sells the most groceries.
It is to answer a more useful question:
Who is using technology best to operate the store and serve the customer?
Research & Analysis: The Industry Group (TIG) / RetailSystems.org
Coverage: United States, Canada and Mexico
Edition: 2026
Technology grades: Independent TIG editorial assessments; preliminary and subject to revision as additional deployment evidence becomes available.
© 2026 The Industry Group / RetailSystems.org
